
⛳ Sena Madureira is situated in or near the subtropical moist forest biome.
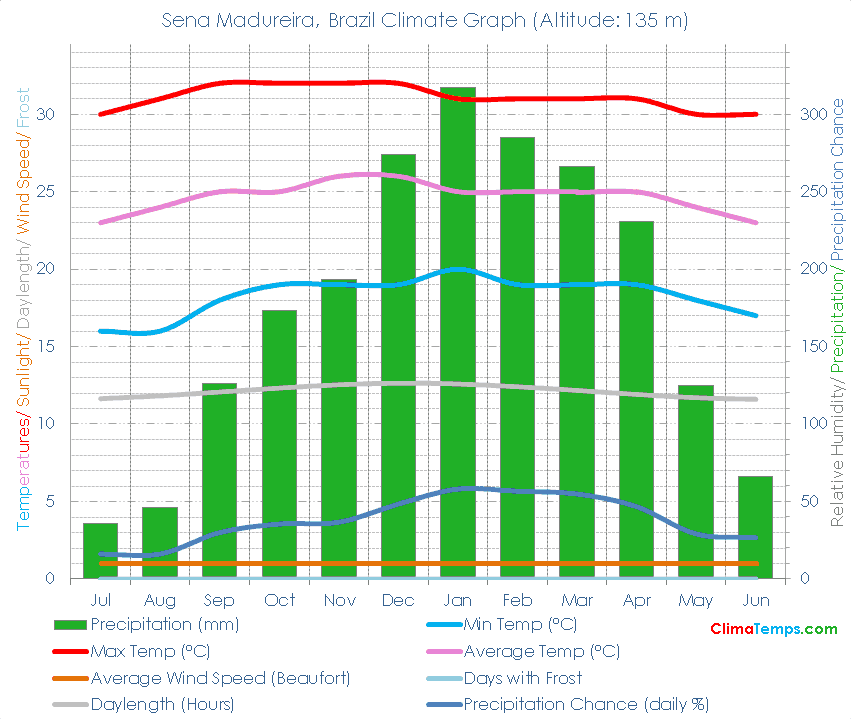
🌡️ The mean annual temperature is 24.7 degrees Celsius (76.4 degrees Fahrenheit). See the temperatures page for a monthly breakdown and the fixed scale graph.
🐬 Average monthly temperatures vary by 3 °C (5.4°F). This indicates that the continentality type is hyperoceanic, subtype truly hyperoceanic.
☔ Total annual precipitation averages 2138 mm (84.2 inches) which is equivalent to 2138 Litres/m² (52.44 Gallons/ft²).
Simply paste the following HTML code into your webpage. Please include a link back to this website. There is one in the following code already. Edit the width attribute to change the size of the graph if needed:
✨ The longest day of the year is 12:31 long on the 21 of December and the shortest day is 11:28 long on the 22 of June.
🐇Were you to burrow down through the centre of the Earth from Sena Madureira you would pop up nearest to the climate station at Ho Chi Minh, Vietnam where you would find a Tropical wet and dry/ savanna climate (Tropical moist forest biome).
🌍Sena Madureira, Brazil is at 9°7'S, 68°40'W, 135 m (443 ft). Check the location on the map.
| Climate Variable | Jul | Aug | Sep | Oct | Nov | Dec | Jan | Feb | Mar | Apr | May | Jun | Annual | ||
|---|---|---|---|---|---|---|---|---|---|---|---|---|---|---|---|
| Average Max Temperature °C ( °F) | 30 (86) | 31 (88) | 32 (90) | 32 (90) | 32 (90) | 32 (90) | 31 (88) | 31 (88) | 31 (88) | 31 (88) | 30 (86) | 30 (86) | 31 (88) | ||
| Average Temperature °C ( °F) | 23 (73) | 24 (75) | 25 (77) | 25 (77) | 26 (79) | 26 (79) | 25 (77) | 25 (77) | 25 (77) | 25 (77) | 24 (75) | 23 (73) | 25 (76) | ||
| Average Min Temperature °C ( °F) | 16 (61) | 16 (61) | 18 (64) | 19 (66) | 19 (66) | 19 (66) | 20 (68) | 19 (66) | 19 (66) | 19 (66) | 18 (64) | 17 (63) | 18 (65) | ||
| Average Precipitation mm (in) | 36 (1) | 46 (2) | 126 (5) | 173 (7) | 193 (8) | 274 (11) | 317 (12) | 285 (11) | 266 (10) | 231 (9) | 125 (5) | 66 (3) | 2138 (84) | ||
| Number of Wet Days (probability of rain on a day %) | 5 (16) | 5 (16) | 9 (30) | 11 (35) | 11 (37) | 15 (48) | 18 (58) | 16 (57) | 17 (55) | 14 (47) | 9 (29) | 8 (27) | 138 (38) | ||
| Average Daylight Hours/ Day | 11h 38' | 11h 49' | 12h 04' | 12h 19' | 12h 32' | 12h 38' | 12h 35' | 12h 24' | 12h 10' | 11h 54' | 11h 41' | 11h 35' | 12h 00' | ||
| Sun altitude at solar noon on the 21st day (°). | 60.4 | 68.9 | 80.2 | 85.8 | 78.6 | 75.7 | 79 | 86.4 | 80.3 | 68.9 | 60.6 | 57.4 | 73.4 |
Please take a moment to share a climate graph or simply the address:
Thank You, so much! ❤️